25 Apr, 2024
Insights, stories, trends, case studies.
To give you a better understanding of the
EXIM business landscape.


Iran Has Exported $35 Billion in Oil in the Last 12 Months, the Highest Level in 5 Years
25 Apr, 2024
In the past 12 months, Iran oil exports have hit a remarkable milestone, reaching $35 billion, marking the highest level in five years. This resurgence in Iran's oil sector is not just a figure but a significant economic rebound amidst geopolitical tensions and sanctions. This article delves into the specifics of this achievement, the key markets for Iran oil exports by country, and the broader implications on global oil dynamics.
The Surge in Iran Oil Exports
Iran oil exports have seen a substantial increase, averaging about 1.29 million barrels per day over the last year, a 50% rise from the previous year. This boost is primarily due to the robust demand from China, which remains the top buyer of Iranian crude. Despite facing stringent sanctions from the West, Iran has managed to sustain and increase its oil output and exports, significantly influencing global oil supply and prices.
This significant uptick in export volumes comes at a critical time when global markets are strained by geopolitical conflicts and supply chain disruptions, notably the conflict between Hamas and Israel and Houthi militant activities in the Red Sea region. Major consuming countries, especially China, which accounts for roughly 90% of these exports, rely on Iran's oil exports, stabilizing the global oil price.
Iran Oil Export Data: A Closer Look
The detailed Iran oil export data reflects several intriguing trends:
- China as the Prime Market: Approximately 90% of Iranian crude oil has been exported to China, showcasing a deepening economic relationship between the two nations.
- Price Adjustments: Iranian crude has been trading at a discount, about $13 less than Brent crude, making it a favourable option for countries willing to engage despite sanctions.
- Strategic Layout: Techniques such as ship-to-ship transfers and falsifying location data have been employed to circumvent sanctions, ensuring continuous flow to critical markets.
Iran Exports Oil to Which Countries?
While China stands out as the primary recipient of Iran oil exports, there are indications that other Asian countries and some European entities might be part of the network, albeit on a much smaller scale. The specifics often remain under wraps due to the geopolitical sensitivities and the sanctions imposed by Western nations.
The Impact of Geopolitical Dynamics on Iran Oil Exports
Geopolitical dynamics have significantly affected Iran oil exports. Oil supply lines could be threatened by the crises in the Middle East, especially the tensions between Israel and the rebel Houthi group. However, these have yet to severely impact Iran's ability to export oil, partly due to strategic alliances and navigational tactics.
Iran Oil News: Recent Developments
Recent Iran oil news highlights a shift in U.S. policy. The Biden administration has shown a relatively lenient stance towards Iran's oil trade, primarily to prevent global oil price spikes. This pragmatic approach is also a strategic move to coax Iran back to the negotiation table for nuclear talks.
Economic Impact of Iran Oil Exports on Global Markets
The substantial increase in Iran oil exports has significant implications for global oil markets. As Iran continues to export large volumes of oil, primarily to China, it contributes to a more diversified worldwide supply and helps stabilize international oil prices. This influx of Iranian oil into the market can temper price spikes that might otherwise occur due to geopolitical tensions or supply disruptions from other major producers.
Additionally, the economic dynamics of Iran oil exports play a crucial role in shaping energy policies and trade balances in consuming countries. For nations heavily reliant on oil imports, such as China, the availability of Iranian oil at discounted rates provides a strategic economic advantage. It allows these countries to reduce dependence on more expensive sources and enhances their energy security. Moreover, the economic interactions fostered by Iran oil exports influence diplomatic relationships and trade negotiations, affecting broader geopolitical alliances and financial policies.
How The Trade Vision Can Help
Trade Vision can provide invaluable assistance to businesses and entities involved in the oil trade, particularly those interested in the complexities of Iran oil exports. With expertise in market analysis, Trade Vision can offer insights into Iran oil export data, assisting companies in recognizing market trends and arriving at wise decisions. Their services can include risk assessment, compliance advice concerning sanctions, and strategic planning for entering new markets or expanding existing ones. Additionally, Trade Vision's network and knowledge of international trade laws can be crucial for companies looking to capitalize on Iran oil exports while adhering to global regulations.
Conclusion: The Road Ahead for Iran Oil Exports
Iran's oil export trajectory will likely be influenced by geopolitical negotiations, global oil demand, and the strategic economic policies of Iran and its trading partners. The interplay between economic benefits and political challenges will define the future path of Iran's oil sector. For nations and businesses involved, staying informed and agile with the help of experts will be vital to understanding this complex but crucial aspect of global energy economics.
FAQs
Q1. How have sanctions impacted Iran oil exports?
Ans: Sanctions have forced Iran to adopt creative measures to export oil, including discounts, secretive shipping practices, and a reliance on non-Western financial systems.
Q2. What does the increase in exports mean for global oil markets?
Ans: The increase in Iranian oil supply is helping to stabilize global oil prices by adding substantial volumes to the worldwide market, which might otherwise be more volatile due to production cuts from other countries.
Q3. What are the risks involved with purchasing Iranian oil?
Ans: Buyers engage in significant legal and geopolitical risks, including potential U.S. and EU sanctions. However, the economic upside in terms of lower prices often outweighs these risks for certain nations.
Q4. Could future negotiations affect Iran oil exports?
Ans: Yes, future diplomatic negotiations, especially concerning nuclear capabilities and sanctions, could significantly alterIran oil exports.

A Detailed Guide of GST Refund on Exports
25 Apr, 2024
0
It can be difficult to understand how the Goods and Services Tax (GST) works, especially the GST refund on exports. Businesses that sell goods or services abroad can make much money if they know how to claim GST back. There are different types of refunds under GST, and this guide will discuss them in detail. It will also discuss how an expert can help businesses make the export GST refund process more effortless.
Understanding GST Refund on Exports
GST refund on exports plays a critical role in the financial dynamics of businesses engaged in international trade. Under the GST framework, exports are treated as 'zero-rated supplies,' meaning the goods or services are taxable, but the effective tax rate applied is zero. This setup is designed to alleviate the tax burden on exporters, ensuring they remain competitive in global markets while recovering the GST paid on inputs used in production.
The rationale behind zero-rated supplies is straightforward: by allowing a full refund of GST on exports, the government avoids cascading tax effects that could inflate export prices and dampen market competitiveness. To effectively utilize this provision, businesses must thoroughly understand the conditions and procedures for claiming their refunds. The process involves meticulous documentation and timely filing, and any negligence or errors can lead to delays or denials of the refund, potentially impacting cash flows significantly. As such, having a clear grasp of the operational aspects of the GST refund on exports is indispensable for businesses operating in the export sector.
What are Zero-Rated Supplies?
Zero-rated supplies under the IGST Act of 2017 encompass all exports of goods and services. This classification allows businesses to claim a complete refund of GST on export, thereby ensuring that their pricing strategies can remain aggressive in overseas markets without the burden of added tax costs.
Understanding zero-rated supplies is crucial for businesses to leverage GST regulations' benefits fully. By recognizing what constitutes zero-rated supplies, companies can better plan their tax strategies and documentation procedures to expedite the GST refund process on exports. This knowledge is particularly beneficial for new exporters or businesses expanding into international markets, as it provides a foundational understanding of tax exemptions available under Indian GST laws.
Moreover, zero-rated supplies also permit the recovery of taxes paid on inputs that contribute to producing exported goods and services. It ensures that while the output is exempt, the input tax credit is still recoverable, reducing overall costs and enhancing business efficiency.
Are There Any Privileges for Exporters Under the GST Refund Scheme?
Exporters enjoy specific privileges under the GST refund on exports scheme, significantly enhancing their financial flexibility and operational efficiency. One of the primary advantages is the ability to claim a full refund of GST on export for goods and services, which helps maintain competitive pricing in global markets. Furthermore, under the scheme, exporters can export goods under a bond or LUT (Letter of Undertaking) without paying IGST, which helps conserve cash flow. This benefit is crucial as it allows businesses to utilize their capital more effectively rather than having it tied up in tax payments. Additionally, the swift processing of refunds under the current regulations ensures that businesses avoid capital blockages, which can be critical for maintaining smooth operational cycles in competitive export markets.
Documentation Needed for GST Refund on Exports
Being aware of what paperwork is necessary and ensuring its correct submission is vital for claiming a GST refund on exports. The primary documents required include the shipping bill, which is integral for exports, as it acts as both a customs document and a tax document. Additionally, the Bank Realization Certificate (BRC) or Foreign Inward Remittance Certificate (FIRC) is crucial for service exports, proving that the exporter has received payment in foreign currency, a prerequisite for claiming GST refunds. Moreover, the Export General Manifest (EGM) must be filed correctly and timely to confirm the export of goods, which is essential for the refund process. Ensuring all these documents are accurate and submitted within the stipulated deadlines is crucial for a hassle-free GST refund on the export process.
Key Elements of the Export GST Refund Process
Understanding the export GST refund process involves several critical steps that businesses must follow to reclaim their taxes successfully.
- Eligibility for GST Refund: To qualify for a GST refund on export of services and goods, businesses must comply with specific criteria, such as exporting under a Letter of Undertaking (LUT) without paying IGST or exporting after paying IGST and claiming the refund. This step is foundational, as non-compliance can lead to outright denial of the refund claim.
- Required Documentation: Essential documents include shipping bills, Bank Realization Certificates (BRC) or Foreign Inward Remittance Certificates (FIRC), and the Export General Manifest (EGM). Each document is critical in substantiating the refund claim and must be submitted accurately and within prescribed timelines.
- Filing and Processing: Once all documents are gathered, exporters must file their refund applications through the GST portal within the specified deadlines. These applications must be comprehensive, including all invoices and bank statements. The GST authorities then review these submissions to verify the eligibility of the claims before processing refunds.
How to Correct Errors in GST Filings?
Mistakes in GST filings can delay or jeopardize the refund process. Here's how to correct them:
Amendments in GSTR-1: If there are errors in the initially filed GSTR-1, corrections can be made in Table-9A or Table-6A in the subsequent filing period. These tables allow exporters to amend details related to export invoices or other relevant data. Ensuring accuracy in these filings is critical as it directly impacts the eligibility and calculation of the GST refund on exports.
Corrections in GSTR-3B: Adjustments for any discrepancies in the export tax paid can be declared in subsequent monthly filings under specific tables designed for corrections. This step is vital for rectifying any previous under-reporting or over-reporting of export-related transactions. Accurate reporting in GSTR-3B helps align the tax credits correctly, ensuring that the GST refund on the export process is seamless and free from discrepancies.
These corrective measures are crucial for reclaiming the correct refund amount and maintaining compliance with GST regulations. Regular monitoring and review of GST filings are recommended to identify and rectify errors promptly. This proactive approach minimizes the risk of delayed refunds and potential legal complications arising from inaccurate tax filings.
Types of Refunds under GST
Understanding the types of refunds under GST is essential for exporters. These include:
- Refund on account of export of goods and services (including zero-rated supplies): This type allows exporters to claim refunds on the GST paid on inputs that were used to manufacture goods or provide services exported.
- Refund of unutilized input tax credit due to inverted duty structure: This occurs when the GST rate on inputs is higher than on the outputs, allowing businesses to claim a refund of the excess credit.
- Refund to suppliers on deemed exports: Certain transactions qualify as exports where goods supplied do not leave the country, but the payment is received in convertible foreign exchange.
Each type of refund has specific documentation and procedural requirements that must be meticulously followed to ensure successful processing. Exporters must familiarize themselves with these requirements and prepare their applications accordingly to avoid any issues in the GST refund on the export process.
Conclusion
While obtaining a GST refund on exports might seem intricate, leveraging the expertise of professionals can simplify these complexities. Enlisting the help of a GST expert from The Trade Vision can be invaluable in this context. Our experts can provide guidance on the correct application procedures, help in the proper filing of documents, and offer advice on legal and regulatory updates. Additionally, they can assist in resolving disputes or discrepancies that may arise during the refund process.
FAQs
Q1. What is the meaning of "refund of GST on export"?
Ans: A "refund of GST on export" refers to the process where exporters can claim back the GST paid on inputs used in producing goods or services that are exported out of the country.
Q2. How does the GST refund process for exports work?
Ans: The export GST refund process involves submitting a refund application and necessary documents such as invoices, shipping bills, and bank statements through the GST portal. GST authorities review the application to verify eligibility before the refund is processed.
Q3. Can you explain the GST refund on the export of services?
Ans: The GST refund on export of services involves claiming a refund for the GST paid on inputs used to render exported services. Like goods, these services must meet specific criteria, such as being provided to recipients outside India.
Q4. What are the different types of refund under GST for exporters?
Ans: The types of refund under GST for exporters include refunds for exports of goods and services as zero-rated supplies, refunds due to the inverted duty structure, and refunds applicable to deemed exports.
Q5. What steps should be taken to ensure a smooth GST refund process for exports?
Ans: To ensure a smooth export GST refund process, exporters should file GST returns accurately and timely, maintain all necessary documentation, and adhere to all specified procedural requirements. Consulting with a GST expert can also help navigate the process's complexities.

The Surge in Chinese Steel Exports Sparks Concerns and Trade Tensions
1 Apr, 2024
0
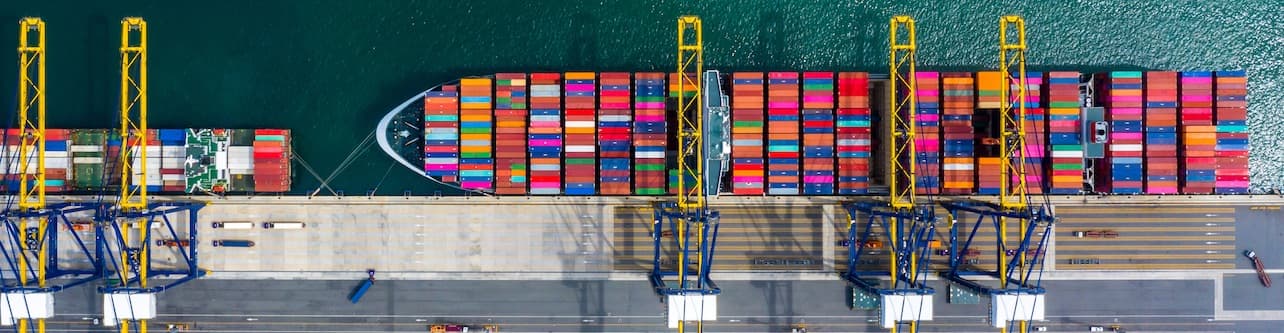
In recent years, the global steel industry has witnessed a significant uptick in Chinese steel exports, raising concerns among steel-producing nations and triggering trade tensions on the international stage. As China solidifies its position as the world's largest steel producer, the ramifications of its export-driven strategy reverberate across markets and economies worldwide. This article delves into the growth of Chinese steel exports, examines its implications for the steel trade, and explores the resulting trade tensions and challenges.
Understanding the Rise in Chinese Steel Exports
China's steel industry has experienced exponential growth over the past few decades, fueled by robust domestic demand, government stimulus measures, and substantial investments in infrastructure and construction projects. As a result, China has emerged as the leading producer and consumer of steel globally, accounting for a significant share of the world's steel output.
However, China's steel production capacity far exceeds domestic demand, leading to an oversupply scenario. To alleviate domestic pressure and sustain its steel industry's growth momentum, China has increasingly turned to the export market, flooding global markets with competitively priced steel products.

Key Factors Driving Chinese Steel Exports:
- Excess Production Capacity: China's steel industry boasts substantial production capacity, supported by state-of-the-art facilities and economies of scale. The surplus capacity enables China to produce vast quantities of steel, surpassing domestic demand and necessitating export avenues to absorb the excess output.
- Competitive Pricing: Chinese steel exporters benefit from lower production costs, owing to factors such as abundant raw materials, economies of scale, and government subsidies. This cost advantage allows Chinese steel products to be competitively priced in international markets, often undercutting domestic producers in other countries.
- Global Demand Dynamics: Despite concerns about quality and environmental standards, Chinese steel exports continue to find eager buyers in regions with high demand for steel, such as Southeast Asia, Africa, and Latin America. Infrastructure development, urbanization, and industrialization projects drive demand for steel products, creating lucrative export opportunities for Chinese manufacturers.
- Trade Policies and Subsidies: China's trade policies and subsidies play a significant role in facilitating steel exports. Government support, including financial incentives, tax rebates, and export credits, bolster the competitiveness of Chinese steel products in the global market, enabling exporters to maintain market share and expand their reach.
Implications of Chinese Steel Exports on the Global Steel Trade
The surge in Chinese steel exports carries multifaceted implications for the global steel trade, affecting steel-producing nations, downstream industries, and international trade dynamics.
- Impact on Domestic Steel Producers: The influx of Chinese steel exports poses a formidable challenge to domestic steel producers in other countries. Unfair competition from low-priced Chinese imports can erode market share, depress prices, and undermine the viability of domestic steel industries, leading to job losses and industry consolidation.
- Quality and Safety Concerns: Chinese steel exports have been subject to scrutiny and criticism regarding quality, safety, and adherence to international standards. Instances of substandard and counterfeit steel products raise concerns about product reliability, performance, and safety, prompting calls for stricter quality control measures and regulatory oversight.
- Trade Imbalances and Protectionism: The surge in Chinese steel exports exacerbates trade imbalances and triggers protectionist sentiments in importing countries. Concerns about unfair trade practices, including dumping, subsidies, and currency manipulation, prompt calls for trade remedies such as tariffs, quotas, and anti-dumping duties to safeguard domestic industries and address trade distortions.
- Global Overcapacity and Price Volatility: China's export-driven strategy contributes to global steel overcapacity, exacerbating price volatility and market instability. Excessive steel production and exports exert downward pressure on global steel prices, impacting profitability and investment decisions across the steel value chain.
Addressing Trade Tensions and Challenges
Addressing the challenges posed by the surge in Chinese steel exports requires collaborative efforts and proactive measures at the national and international levels. Key strategies include:
- Multilateral Dialogue and Cooperation: Engaging in constructive dialogue and cooperation through international forums such as the World Trade Organization (WTO) facilitates discussions on trade issues, promotes transparency, and seeks consensus-based solutions to address global steel overcapacity and trade distortions.
- Enforcement of Trade Remedies: Implementing and enforcing trade remedies, including anti-dumping measures, countervailing duties, and safeguard measures, provides a legal framework to address unfair trade practices and protect domestic industries from the adverse effects of subsidized and dumped imports.
- Quality Certification and Standards Compliance: Strengthening quality certification processes and ensuring compliance with international standards enhances the credibility and competitiveness of steel products in global markets. Promoting adherence to quality, safety, and environmental standards fosters consumer confidence and reduces the proliferation of substandard imports.
- Diversification of Export Markets: Diversifying export markets and reducing reliance on a single market or region helps mitigate risks associated with market fluctuations and trade disruptions. Exploring emerging markets, investing in market research, and cultivating strategic partnerships enhance market resilience and facilitate sustainable export growth.

The growth of Chinese steel exports presents both opportunities and challenges for the global steel industry and international trade. While Chinese steel products contribute to infrastructure development and economic growth in importing countries, they also pose significant competitive pressures and trade tensions for domestic steel producers worldwide. Addressing the complexities of global trade and trade data requires concerted efforts to promote fair competition, uphold quality standards, and foster a level playing field for all stakeholders. By embracing dialogue, cooperation, and proactive measures, the steel industry can navigate the challenges posed by Chinese steel exports and foster a more sustainable and balanced global trade environment.
FAQs:
Q1. What are the main concerns associated with the surge in Chinese steel exports?
Ans: The surge in Chinese steel exports raises concerns about unfair competition, market distortions, job losses in domestic industries, quality and safety issues, and trade tensions among steel-producing nations.
Q2. How do Chinese steel exports affect domestic steel industries in other countries?
Ans: Chinese steel exports can undercut domestic steel producers in other countries by offering lower-priced products, leading to decreased market share, depressed prices, and potential industry consolidation or closures.
Q3. What measures can be taken to address the challenges posed by Chinese steel exports?
Ans: Strategies to address the challenges include enforcing trade remedies, promoting quality certification and standards compliance, diversifying export markets, and engaging in multilateral dialogue and cooperation to address global steel overcapacity and trade imbalances.
Q4. What role do trade policies and subsidies play in facilitating Chinese steel exports?
Ans: Trade policies and subsidies, including financial incentives, tax rebates, and export credits, bolster the competitiveness of Chinese steel products in the global market, enabling exporters to maintain market share and expand their reach.
Q5. How can countries balance the benefits of Chinese steel imports with the need to protect domestic industries?
Ans: Countries can balance the benefits of Chinese steel imports with the need to protect domestic industries by implementing trade remedies, promoting fair competition, strengthening quality standards, and diversifying export markets to reduce reliance on a single source of imports.

Exporting Indias Finest Brew: A Comprehensive Guide to Tea Export from India
29 Mar, 2024
0
India, renowned for its rich cultural heritage and diverse flavors, stands as a prominent player in the global tea market. With a long-standing tradition of tea cultivation and production, the country offers a wide array of exquisite teas that captivate palates worldwide. This article serves as a comprehensive guide to exporting tea from India to other countries, exploring the best practices, opportunities, and insights into the thriving Indian tea industry.
The Significance of Indian Tea
India boasts a proud legacy in the tea industry, producing some of the world's finest teas renowned for their unique flavors, aroma, and quality. From the robust Assam teas to the delicate Darjeeling varieties, Indian tea holds a special place in the hearts of tea enthusiasts globally. The diverse geography and climate of India's tea-growing regions contribute to the distinct characteristics of each tea, making them highly sought after in international markets.

Exploring the Best Tea Regions in India
1. Assam: Known for its bold and malty flavors, Assam produces robust black teas favored for their strength and richness. The fertile plains of the Brahmaputra Valley nurture the Assam tea bushes, yielding teas prized for their deep coppery hue and brisk character.
2. Darjeeling: Nestled in the foothills of the Himalayas, Darjeeling is celebrated for its exquisite and aromatic teas. Often referred to as the "Champagne of Teas," Darjeeling teas offer delicate floral notes and a muscatel flavor profile that distinguishes them as a connoisseur's choice.
3. Nilgiris: Situated in the picturesque Nilgiri hills of southern India, this region produces teas known for their smoothness, briskness, and bright liquor. Nilgiri teas are prized for their versatility, making them ideal for blending and complementing a range of flavors.
4. Kangra: Located in the serene Kangra Valley of Himachal Pradesh, this lesser-known tea region produces teas with a unique character and complexity. Kangra teas are celebrated for their floral aroma, subtle sweetness, and distinctive muscatel flavor.
Exporting Indian Tea: Key Considerations
- Quality Assurance: To maintain India's reputation for producing high-quality teas, exporters must prioritize stringent quality control measures at every stage of production, processing, and packaging. Adhering to international quality standards and certifications enhances the marketability and credibility of Indian teas in foreign markets.
- Market Research: Conducting thorough market research is essential to identify target markets, understand consumer preferences, and assess competition. Analyzing trends, demand patterns, and regulatory requirements enables exporters to tailor their offerings and strategies to meet the specific needs of each market.
- Regulatory Compliance: Exporting tea from India entails compliance with various regulations and standards governing food safety, labeling, and packaging in destination countries. Exporters must ensure adherence to regulatory requirements, obtain necessary certifications, and provide accurate documentation to facilitate customs clearance and market access.
- Packaging and Branding: Packaging plays a pivotal role in influencing consumer perception and purchase decisions. Exporters should invest in attractive, durable packaging that preserves the freshness and integrity of Indian teas while reflecting the brand's identity and values. Innovative packaging designs and branding strategies can enhance product visibility and appeal in competitive markets.
Seizing Opportunities in the Global Tea Trade
- Diversification of Product Portfolio: Indian tea exporters can leverage the country's diverse tea-growing regions to offer a wide range of specialty teas catering to evolving consumer preferences. From organic and single-origin teas to flavored and herbal blends, diversifying the product portfolio enables exporters to target niche markets and differentiate their offerings.
- E-commerce Platforms: The growing popularity of e-commerce platforms presents lucrative opportunities for Indian tea exporters to reach a global audience directly. Establishing an online presence and leveraging digital marketing channels facilitate accessibility, engagement, and sales growth in the competitive online marketplace.
- Participation in Trade Fairs and Exhibitions: Participating in international trade fairs and exhibitions provides Indian tea exporters with a platform to showcase their products, network with industry stakeholders, and explore potential collaborations and partnerships. These events serve as valuable opportunities to gain market insights, forge new business connections, and expand market reach.
Conclusion
Exporting tea from India to other countries offers immense opportunities for growth and expansion in the global tea market. With its rich heritage, diverse tea offerings, and commitment to quality, India stands poised to captivate tea enthusiasts worldwide. By adhering to best practices, conducting thorough market research, and embracing innovation, Indian tea exporters can unlock the full potential of the country's tea industry and establish a formidable presence on the international stage.
As India continues to assert its position as a leading tea exporter, the journey from leaf to cup embodies a timeless tradition infused with passion, craftsmanship, and a commitment to excellence.

Exporting tea from India presents a world of opportunities for growth and success in global trade and trade data. With its rich heritage, diverse offerings, and unwavering commitment to quality, India continues to leave an indelible mark on the global tea industry, one cup at a time.
FAQs:
Q1. What makes Indian tea unique compared to teas from other regions?
Ans: Indian tea is renowned for its diverse flavors, aroma, and quality, attributed to the country's unique geography, climate, and cultivation practices. Each tea-growing region in India offers distinct varieties, ranging from robust Assam teas to delicate Darjeeling blends, catering to a wide spectrum of taste preferences.
Q2. How can Indian tea exporters ensure the freshness and quality of teas during the export process?
Ans: Indian tea exporters prioritize stringent quality control measures, including careful selection of tea leaves, prompt processing, and airtight packaging to preserve freshness and flavor. Regular quality inspections and adherence to international quality standards further ensure the superior quality of Indian teas in the global market.
Q3. What are some emerging trends in the global tea market that Indian exporters should be aware of?
Ans: Emerging trends in the global tea market include the growing demand for specialty and premium teas, increased consumer interest in health and wellness teas, and the rising popularity of sustainable and ethically sourced teas. Indian exporters can capitalize on these trends by innovating their product offerings, embracing sustainability practices, and targeting niche markets.
Q4. How can Indian tea exporters navigate trade barriers and regulatory requirements in foreign markets?
Ans: Indian tea exporters must conduct thorough research on regulatory requirements, import regulations, and labeling standards in target markets. Seeking guidance from trade associations, engaging with regulatory authorities, and obtaining necessary certifications and documentation are essential steps to ensure compliance and facilitate market access.
Q5. What strategies can Indian tea exporters employ to enhance brand visibility and market presence in foreign countries?
Ans: Indian tea exporters can enhance brand visibility and market presence by leveraging digital marketing channels, participating in trade fairs and exhibitions, forging strategic partnerships with distributors and retailers, and offering personalized customer experiences. Building a strong brand identity, communicating the unique attributes of Indian teas, and delivering exceptional quality and service are key to establishing a lasting impression in foreign markets.

Effect on India Rice Export Due to Red Sea Attacks
28 Mar, 2024
0
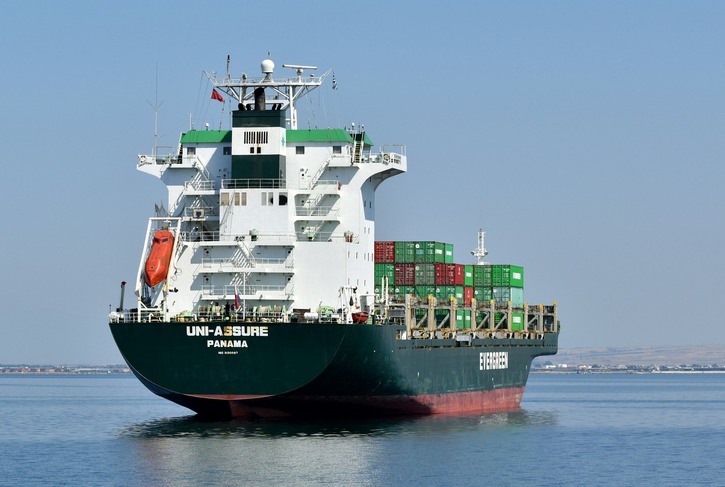
Global trade has faced unprecedented challenges in recent months, with the agricultural sector having a significant impact. Among these challenges, the attacks in the Red Sea have emerged as a critical concern, particularly for the rice world production and export industry. India, a top rice exporter, mainly basmati rice export, is at the centre of this crisis. This situation has implications for global rice shortage and world rice shortage, affecting countries worldwide that depend on India for their rice supply. This article explores the effects of these attacks on India's rice export and the broader implications for global markets.
The Impact on India's Rice Export
- The Immediate Fallout
The attacks in the Red Sea have posed significant logistical and security challenges for shipping routes crucial for rice export news. This disruption has led to delays and increased shipping costs, directly impacting basmati exports from India and other rice varieties. The immediate fallout is a decrease in India's reliability as a rice supplier, potentially leading to a global rice shortage.
- Rising Costs and Pricing Pressures
Increased shipping costs due to rerouted shipments and enhanced security measures have led to higher prices for Indian rice on the global market. This situation exacerbates the world rice shortage, making it difficult for importing countries to manage their food security concerns affordably.
Broader Implications for Global Markets
- Threat to Food Security
The global rice shortage resulting from disrupted rice world production and export channels threatens food security in many countries. Rice is a staple food for over half the world's population, and any significant disruption in its supply can have far-reaching consequences.
- Impact on Global Prices
The world rice shortage can potentially drive up rice prices globally, affecting not just the importers of Indian rice but also countries that rely on other suppliers. The interconnectedness of global markets means that price increases in one part of the world can ripple through to others, impacting global food inflation.

Overcoming Challenges
- Diversification of Supply Channels
One potential strategy to mitigate the impact of the attacks in the Red Sea is to diversify supply channels. Exploring alternative shipping routes and sources of rice can help stabilize rice export news and supply.
- Technological and Strategic Solutions
Investing in technology to improve supply chain resilience and adopting strategic stockpiling practices can also help countries better manage the risks associated with a global rice shortage.
How Do the Attacks in the Red Sea Affect Global Rice Production?
- Disruption of Supply Chains: The attacks in the Red Sea have led to significant disruptions in the shipping routes critical for rice world production, causing delays and uncertainties in the global rice supply.
- Increased Costs for Exporters: These attacks have escalated security and insurance costs for shippers, directly affecting the price of basmati rice export and other varieties from India contributing to a global rice shortage.
- Impact on Basmati Export from India: These disruptions could affect the premium market segment, specifically basmati rice export, where timely delivery and product quality are paramount.
- Alternatives and Adaptations: In response, exporters and countries might seek alternative routes or methods, potentially affecting rice export news with new agreements or diplomatic efforts to ensure security and continuity of trade.
What Are the Global Implications of a Rice Shortage?
- Food Security Concerns: A world rice shortage could exacerbate food insecurity in vulnerable regions where rice is a staple diet for millions.
- Price Volatility: Shortages typically lead to price increases, making rice less affordable for consumers worldwide and escalating the issue of global rice shortage.
- Shifts in Trade Dynamics: Countries might seek new trading partners or increase their rice world production capacities, altering the traditional rice export news landscape.
- Innovation in Agriculture: The shortage might accelerate investment in agricultural technologies to increase yield and efficiency in rice world production, aiming to mitigate future shortages.
Read more: The white staple is high in demand
How Can Stakeholders Mitigate the Impact of These Challenges?
- Diversifying Sources: Importing countries could diversify their sources of rice to reduce dependency on basmati export from India and other affected exporters.
- Strategic Reserves: Building and maintaining strategic rice reserves can help buffer against short-term disruptions in world rice shortage, ensuring a steady supply.
- Technological Investments: Investing in technology to enhance rice world production efficiency and resilience, from precision farming to supply chain management tools, can mitigate the effects of global rice shortage.
- International Cooperation: Strengthening international cooperation and dialogue can lead to more coordinated responses to crises affecting rice export news, including diplomatic efforts to ensure the security of critical maritime routes.
The Trade Vision, as a reputed EXIM data provider, offers invaluable insights and analytics that can help businesses navigate the complexities of global trade, especially in times of uncertainty like the attacks in the Red Sea.

How Can the International Community Support Affected Countries?
- Financial Aid and Technical Support: Financial aid and technical assistance to enhance rice world production capabilities in affected regions can help mitigate the impact of global rice shortage.
- Trade Agreements: Facilitating new trade agreements or relaxing existing ones can help ensure a steady flow of rice and other essential goods, countering the effects of the world rice shortage.
- Research and Development: Supporting research into more resilient rice strains and more efficient farming practices can increase productivity and sustainability, benefiting basmati export from India and global rice production.
What Lessons Can Be Learned from This Crisis?
- Importance of Supply Chain Diversification: This crisis highlights the critical need for countries to diversify their supply chains to reduce vulnerability to global rice shortage.
- Resilience Building: Developing more resilient infrastructure and logistics capabilities is essential to withstand disruptions like the attacks in Red Sea.
- Cooperation Over Competition: The rice export news underscores the importance of international collaboration over competition, encouraging collective efforts to address food security challenges.
Looking Ahead with The Trade Vision
As the situation evolves, platforms like The Trade Vision offer valuable insights and forecasts for the rice world production and basmati export from India. By analyzing market trends and geopolitical developments, The Trade Vision guides businesses through the complexities of international trade in these turbulent times.
The attacks in the Red Sea present a significant challenge to India's rice export and the broader issue of global rice shortage. By understanding these impacts and exploring solutions, stakeholders can work towards minimizing disruption and ensuring food security for populations worldwide.
FAQs:
Q1. What can consumers do to mitigate the impact of a rice shortage?
Ans: Consumers can contribute by diversifying their diets and reducing waste, thereby lessening the demand pressure on rice supplies.
Q2. How long will the impact of the Red Sea attacks last?
Ans: The impact duration is still being determined and will depend on the resolution of security issues and the ability of trade routes to adapt to new challenges.
Q3. What impact do logistics and transportation have on rice availability?
Ans: Logistics and transportation are crucial for running rice world production and distribution. Disruptions in shipping routes, like the attacks in the Red Sea, can significantly impact basmati export from India and the overall global supply chain, leading to delays and increased costs.
What Is IEC Code: A Detailed Guide to It
27 Mar, 2024
0
Understanding the essentials can pave the way for a flourishing business in global trade. One important thing that stands out is the Import Export Code (IEC). Often, newcomers and even seasoned traders find themselves pondering questions like what the IEC code is, what an import export license is, and what the benefits of an import export license are. This comprehensive guide aims to unravel the mysteries surrounding the IEC code. It offers a clear insight into its importance, the application process, and how it benefits traders.
What Is Import Export Code?
Import Export Code (IEC) is a unique 10-digit code necessary for businesses importing and exporting goods. This code is issued by the Directorate General of Foreign Trade (DGFT), Ministry of Commerce and Industries, Government of India. The essence of what is IEC code lies in its role as a key to entering the global market, making it an indispensable part of international trade.
Why Is It Mandatory?
The IEC code is not just another bureaucratic formality; it serves as a vital document for recognizing a business as a legitimate participant in international trade. With this code, businesses can legally import or export goods. It also facilitates the smooth clearance of shipments at customs. It enables companies to avail themselves of benefits under the Export Promotion Capital Goods (EPCG) and the Duty Drawback Scheme.
The Application Process
Securing an IEC code is a streamlined process that encourages businesses to expand their horizons globally. Here's a brief overview:
- Preparation: Before applying, ensure all required documents, such as PAN cards, business registration certificates, and bank details, are in order.
- Application: The application for the Import Export Code is submitted online through the DGFT's official website. The necessary documents and the prescribed fee must accompany it.
- Processing: Once submitted, the application is processed by the DGFT. If all details are correct and documents are in order, the IEC code is usually issued within a few days.
This procedure demystifies what is import export license and showcases how accessible the government has made international trading.
Benefits of Import Export License
- The Gateway to Global Trade
The most direct benefit of the import export license is its role as a gateway for businesses to enter international markets. It legitimizes a business's trade activities and opens up opportunities for growth and expansion.
- Financial Incentives
Holding an IEC code allows businesses to benefit from various government schemes. These incentives, ranging from tax rebates to subsidies, are designed to support businesses in the competitive international market.
- Easy Clearances
For those wondering what import-export codes are used for beyond mere compliance, they play a critical role in facilitating easier customs clearance for both imports and exports. This efficiency is crucial for businesses to maintain timely deliveries and operations.
How Can Businesses Ensure Compliance and Manage Documentation Efficiently?
Understanding, what is import export license involves recognizing the importance of compliance and efficient documentation management. Here are vital pointers to navigate this aspect:
- Stay Informed: Regularly update your knowledge of international trade laws and regulations. It ensures your business operations align with global standards.
- Organize Documentation: Keep all trade-related documents, such as invoices and packing lists, organized and readily accessible. It helps in smooth customs clearance.
- Leverage IEC Code: Use your Import Export Code effectively to simplify and expedite the documentation process, taking full advantage of the benefits of import export license.
- Seek Expertise: Consider consulting with trade experts or platforms like The Trade Vision for insights into complex compliance requirements.
How Can Leveraging Technology Benefit International Trade Operations?
Incorporating technology into your international trade operations can significantly enhance efficiency and competitiveness. Here are ways technology intersects with what is IEC code:
- Embrace EDI Systems: Implement electronic data interchange (EDI) systems for faster, more accurate document handling.
- Adopt Blockchain: Explore blockchain for secure, transparent transactions, enhancing trust in international dealings.
- Utilize Analytical Tools: Use data analytics to understand market trends, manage risks, and make informed decisions, maximizing the benefits of import export license.
- Digitalize for Efficiency: Digitize trade processes where possible to reduce paperwork, save time, and decrease the risk of errors, fully embracing what is import export code in the digital age.

Looking to the Future with The Trade Vision
Platforms like The Trade Vision play a pivotal role as we steer towards a future marked by the digitalization of trade and streamlined global operations. They offer a wealth of knowledge and tools for businesses to not only understand what is IEC code is but also to overcome the complexities of international trade efficiently. With insights into market trends, regulatory changes, and strategic advice, The Trade Vision supports businesses leveraging their import export license for maximum benefit.
The Import Export Code is a cornerstone for businesses aiming to make their mark internationally. Understanding what is import export code, its application process, and the benefits of import export license equips traders with the knowledge to unlock global opportunities. As the world becomes more interconnected, the significance of the IEC code in fostering international trade relations and supporting business growth cannot be overstated. With resources like The Trade Vision, businesses are better positioned than ever to navigate the complexities of global trade and harness the full potential of their international endeavours.
FAQs:
Q1. Can a business operate without an IEC Code?
Ans: Engaging in import or export activities without a valid IEC code is illegal and can result in severe penalties. The IEC code is foundational for establishing a legitimate international trading business.
Q2. Is renewal required for IEC Code?
Ans: One of the attractive features of the IEC code is that it is issued for a lifetime. Once obtained, renewal is unnecessary, simplifying long-term business planning and operations.
Q3. What happens if I lose my IEC Code?
Ans: If you lose your IEC code, obtaining a duplicate is straightforward. The DGFT can be contacted with the necessary documents and a nominal fee to issue a duplicate code.
Q4. Can any business apply for an IEC Code?
Ans: Any business aiming to trade internationally can apply for an Import Export Code. The requirement is a valid business registration and a PAN card, making the process accessible.
Q5. How does the IEC Code facilitate global trade?
Ans: The Import Export Code legalizes international trade for businesses, streamlines customs clearance, enables access to government benefits, and enhances credibility with global partners and financial institutions.

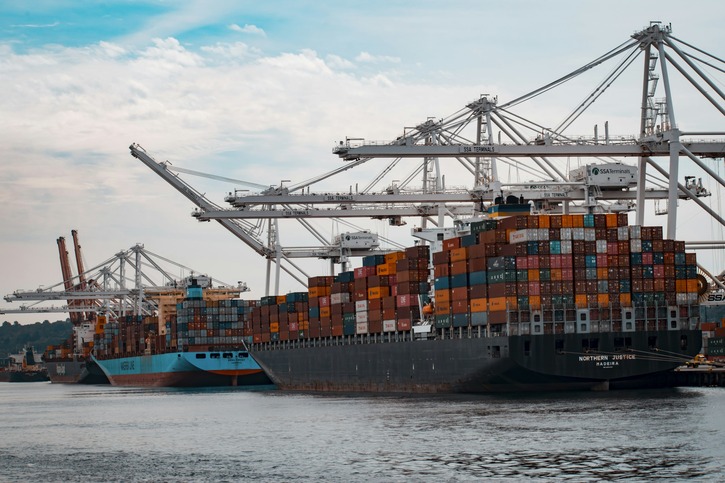
The Best Practices of Import and Export Operations in Supply Chain Management
26 Mar, 2024
0
Introduction:
Efficient import and export operations are integral components of supply chain management. Whether it's sourcing raw materials, manufacturing goods, or distributing products, optimizing import and export processes is crucial for businesses to remain competitive in the international market. This article explores the best practices and strategies for streamlining import and export operations within supply chain management.
Understanding Import and Export in Supply Chain Management
Import and export operations involve the movement of goods and services across international borders. In supply chain management, these processes encompass various stages, from procurement and production to distribution and delivery. Effective management of import and export activities ensures seamless flow and timely delivery of products while minimizing costs and risks.
Key Components of Import and Export Supply Chain
Compliance and Regulatory Considerations:
- Understanding Trade Regulations: Stay abreast of import and export regulations, tariffs, and trade agreements relevant to specific markets.
- Documentation Management: Ensure accurate and timely completion of customs documentation, including invoices, certificates of origin, and permits.
- Compliance Audits: Conduct regular audits to ensure adherence to regulatory requirements and mitigate the risk of penalties or delays.
Supplier and Partner Collaboration:
- Vendor Selection: Choose reliable suppliers and partners with a proven track record of compliance, quality, and reliability.
- Transparent Communication: Establish open communication channels with suppliers and partners to anticipate and address potential issues proactively.
- Collaboration Tools: Utilize digital platforms and tools for real-time tracking, inventory management, and collaboration with stakeholders across the supply chain.
Logistics and Transportation Optimization:
- Mode Selection: Evaluate the most cost-effective and efficient transportation modes, such as air, sea, road, or rail, based on factors like distance, urgency, and cargo volume.
- Route Optimization: Optimize shipping routes to minimize transit time, reduce fuel consumption, and mitigate risks associated with disruptions or congestion.
- Freight Forwarding Services: Partner with experienced freight forwarders to handle logistics complexities, customs clearance, and documentation requirements efficiently.
Risk Management and Contingency Planning:
- Supply Chain Visibility: Implement technology-driven solutions for real-time tracking and monitoring of shipments, enabling early detection of potential disruptions.
- Risk Assessment: Identify and assess potential risks, including geopolitical instability, natural disasters, or supplier disruptions, and develop contingency plans to mitigate their impact.
- Insurance Coverage: Obtain appropriate insurance coverage to protect against unforeseen events and mitigate financial losses associated with damaged or lost shipments.
Best Practices for Import Supply Chain Process:
- Streamlined Customs Clearance: Implement automated customs clearance processes and leverage customs brokers to expedite clearance and reduce delays.
- Tariff Classification: Ensure accurate tariff classification of imported goods to minimize duty costs and compliance risks.
- Duty Optimization: Explore duty reduction programs, such as free trade agreements or preferential tariff schemes, to minimize import duties and taxes.
- Inventory Management: Adopt advanced inventory management systems to optimize stock levels, reduce carrying costs, and improve order fulfillment efficiency.
Best Practices for Export Supply Chain Process:
- Market Research and Localization: Conduct market research to identify export opportunities and tailor products or services to meet the needs and preferences of target markets.
- Export Compliance Training: Provide training to staff involved in export operations to ensure awareness of export controls, sanctions, and regulatory requirements.
- Export Documentation Automation: Utilize digital platforms and software solutions for automating export documentation processes, reducing errors, and enhancing compliance.
- Trade Financing: Explore export financing options, such as letters of credit or export credit insurance, to mitigate financial risks and facilitate international transactions.
Read more: How to Get Import Export Data for Any Country
|
|||||||||||||||||||||||
FAQs:
Q1. What are the key considerations when selecting suppliers for import operations?
Ans: When selecting suppliers for import operations, it's crucial to consider factors such as reliability, quality, compliance, and cost-effectiveness. Look for suppliers with a proven track record of timely delivery, adherence to regulatory requirements, consistent product quality, and competitive pricing. Conduct thorough due diligence, including supplier audits and reference checks, to ensure compatibility with your supply chain goals and requirements.
Q2. How can businesses mitigate the risks associated with import/export compliance?
Ans: Businesses can mitigate compliance risks by staying informed about import/export regulations, maintaining accurate documentation, conducting regular compliance audits, and investing in employee training. Additionally, leveraging technology solutions for automated compliance checks and implementing robust risk management processes, such as risk assessments and contingency planning, can help identify and address compliance issues proactively.
Q3. What role does technology play in optimizing import/export operations?
Ans: Technology plays a crucial role in optimizing import/export operations by providing real-time visibility and control over shipments, streamlining documentation processes, enhancing communication and collaboration with stakeholders, and facilitating data-driven decision-making. Advanced technologies such as blockchain, artificial intelligence, and Internet of Things (IoT) enable greater transparency, efficiency, and traceability across the supply chain, leading to improved operational performance and customer satisfaction.
Q4. How can businesses ensure effective communication and collaboration across the import/export supply chain?
Ans: Effective communication and collaboration across the import/export supply chain can be ensured by establishing clear communication channels, fostering open dialogue among stakeholders, leveraging digital collaboration tools and platforms, and implementing standardized processes and procedures. Regular communication, feedback mechanisms, and performance reviews can help align goals, resolve issues, and build trust among supply chain partners.
Q5. What are some common challenges faced by businesses in import/export operations, and how can they be addressed?
Ans: Common challenges in import/export operations include regulatory compliance, customs clearance delays, transportation inefficiencies, currency fluctuations, geopolitical risks, and supplier/vendor management. To address these challenges, businesses can adopt proactive risk management strategies, invest in technology solutions for automation and visibility, diversify sourcing and distribution channels, establish robust supplier relationships, and stay agile and adaptable to changing market conditions. Additionally, seeking guidance from industry experts and trade associations can provide valuable insights and support in navigating complex import/export landscapes.
Conclusion:
Efficient import and export operations are vital for the success of supply chain management in today's global marketplace. By implementing best practices, leveraging technology, and fostering collaboration across the supply chain, businesses can optimize import and export processes, enhance operational efficiency, and gain a competitive edge in the international arena. Embracing innovation and continuous improvement is key to navigating the complexities of global trade and achieving sustainable growth in an increasingly interconnected world

Essential Documents Required for Import and Export: A Comprehensive Guide
22 Mar, 2024
0
In international trade, ensuring smooth import and export operations is contingent upon meticulous documentation. Whether you're importing goods to meet demand or exporting products to explore new markets, having the right paperwork in order is crucial. This article serves as a comprehensive guide, outlining the essential documents required for import and export transactions.
Understanding Import and Export Documentation
Before delving into the specific documents needed for import and export, it's essential to grasp the significance of documentation in facilitating global trade. Import and export documentation serves multiple purposes, including regulatory compliance, customs clearance, payment facilitation, and dispute resolution. Proper documentation not only expedites the movement of goods across borders but also mitigates risks and ensures transparency in transactions.

List of Documents Required for Import
1. Import License or Permit: Depending on the nature of the goods and regulatory requirements of the importing country, an import license or permit may be necessary. This document authorizes the importer to bring specified goods into the country.
2. Commercial Invoice: The commercial invoice serves as a bill of sale between the buyer and seller, detailing the description, quantity, value, and terms of the goods being imported. It is essential for customs clearance and valuation purposes.
3. Packing List: This document provides a detailed list of the contents, packaging specifications, and weight of each package within the shipment. It assists customs officials in verifying the contents of the shipment and ensures accurate handling and delivery.
4. Bill of Lading (B/L): Issued by the carrier or freight forwarder, the bill of lading serves as a contract of carriage and a receipt for the goods being transported. It contains essential information such as the shipper, consignee, vessel details, and terms of shipment.
5. Certificate of Origin: This document certifies the country of origin of the goods and may be required for customs clearance, trade agreements, or preferential tariff treatment. It is typically issued by the exporter or a designated authority.
6. Import Declaration Form: Also known as a customs declaration or entry form, this document provides detailed information about the imported goods, including their classification, value, and origin. It is submitted to customs authorities for assessment of duties and taxes.
7. Import Permit for Restricted Goods: Certain goods may require additional permits or approvals for importation due to regulatory restrictions or safety concerns. Examples include firearms, pharmaceuticals, and hazardous materials.
List of Documents Required for Export
1. Export License or Permit: Similar to import permits, export licenses or permits may be required for certain goods subject to export controls or regulatory restrictions. This document authorizes the exporter to ship specified goods out of the country.
2. Export Declaration Form: This document provides detailed information about the exported goods, including their description, quantity, value, destination, and intended use. It is submitted to customs authorities for regulatory compliance and statistical purposes.
3. Commercial Invoice: Just like in import transactions, a commercial invoice is essential for export transactions. It serves as a legal document evidencing the sale of goods between the exporter and importer, facilitating payment and customs clearance.
4. Packing List: Similar to import shipments, a packing list detailing the contents, packaging, and weight of each package is necessary for export shipments. It aids in cargo handling, inspection, and verification by customs officials.
5. Bill of Lading (B/L) or Air Waybill (AWB): Depending on the mode of transportation, either a bill of lading for sea shipments or an air waybill for air shipments is required. These documents serve as contracts of carriage and provide proof of shipment and delivery.
6. Certificate of Origin: In export transactions, a certificate of origin attests to the country of origin of the goods. It may be required by customs authorities in the importing country for tariff classification and eligibility for preferential trade agreements.
7. Export Packing Declaration: This document certifies that the goods have been properly packed, labeled, and marked in accordance with regulatory requirements and international standards. It ensures compliance with safety, security, and transport regulations.
8. Export License for Controlled Goods: For goods subject to export controls, such as military equipment, dual-use items, or sensitive technologies, an export license may be necessary. This document ensures compliance with export regulations and prevents the proliferation of restricted goods.
Read more: What Is International Trade: Everything You Need to Know About Its Types and Importance

Navigating the complexities of import and export operations requires meticulous attention to documentation requirements. From import permits to export declarations, each document plays a vital role in facilitating trade, ensuring regulatory compliance, and mitigating risks.
FAQs:
Q1. What is an Import/Export License or Permit, and why is it required?
Ans: An import/export license or permit is a regulatory document issued by the relevant authorities authorizing the movement of specified goods across international borders. It is required to ensure compliance with import/export regulations, monitor trade activities, and prevent the illicit movement of restricted or controlled goods.
Q2. What are the consequences of non-compliance with import/export documentation requirements?
Ans: Non-compliance with import/export documentation requirements can result in various consequences, including customs delays, fines, penalties, seizure of goods, and legal action. Additionally, it can damage business reputation, disrupt supply chains, and hinder market access.
Q3. How can businesses obtain import/export permits or licenses?
Ans: The process for obtaining import/export permits or licenses varies depending on the country, type of goods, and regulatory requirements. Generally, businesses need to submit applications to the relevant government agencies or customs authorities, providing details about the goods, intended use, destination, and compliance measures.
Q4. What are the differences between a Bill of Lading and an Air Waybill in export transactions?
Ans: A Bill of Lading (B/L) is a document issued for sea shipments, serving as a contract of carriage and a receipt for the goods being transported. An Air Waybill (AWB) is used for air shipments and serves similar purposes. While both documents evidence the shipment of goods, they differ in terms of the mode of transportation and specific information included.
Q5. Are there any resources or platforms available to assist businesses with import/export documentation requirements?
Ans: Yes, several resources and platforms are available to assist businesses with import/export documentation requirements, including government websites, trade associations, customs brokers, and digital trade platforms. These resources provide guidance, templates, and tools to facilitate the preparation and submission of import/export documents, ensuring compliance and efficiency in international trade transactions.
Conclusion:
Accurate and complete documentation is the cornerstone of successful import and export operations. By understanding the specific documents required for import and export transactions and adhering to regulatory requirements, businesses can minimize risks, expedite customs clearance, and foster smooth and efficient trade relationships on a global scale. Whether importing raw materials or exporting finished products, having the right paperwork in order is essential for navigating the complexities of international trade and capitalizing on market opportunities.

Mexico Has Surpassed China as the Primary Source of Goods Imported by the US
21 Mar, 2024
0
In a crucial shift in global trade dynamics, Mexico has overtaken China to become the primary source of goods imported by the United States. This transition underscores international commerce's evolving nature and the deepening of Mexico-US trade relations. According to data from the US Commerce Department, the value of goods imported from Mexico to the US saw a nearly 5% increase from 2022 to 2023, reaching over $475 billion. Concurrently, the value of goods imported from China saw a 20% decrease, totalling $427 billion. This article looks into the factors behind this shift, its implications, and what might signal for future trade between the United States and Mexico.
The Rise of Mexico as a Trade Partner
Mexico's ascent as the top source of import goods for the US is gradual but the result of several factors. Proximity is critical, offering logistical advantages like lower shipping costs and faster delivery times compared to distant Asian markets. Furthermore, Mexico's participation in the USMCA (United States-Mexico-Canada Agreement) has fostered a more favourable trade environment, encouraging businesses to import goods from Mexico to the US.
Declining Imports from China
Simultaneously, the reduction in Chinese imports can be attributed to a mix of tariffs, geopolitical tensions, and companies diversifying their supply chains in response to recent global disruptions. These factors have compelled businesses to reconsider their sourcing strategies, increasingly turning to Mexico as a reliable alternative.

Understanding the Impact
- On the Economy
This shift in trade between the United States and Mexico bolsters economic ties, potentially leading to more job creation and investment in both countries. For the US, accessing a diverse range of products more efficiently supports consumer demand and business needs.
- On Supply Chains
The proximity of Mexico considerably enhances supply chain resilience for American companies. Quicker turnaround times and reduced transportation costs benefit businesses and contribute to lower carbon footprints, aligning with growing sustainability goals. What Does This Mean for Businesses?
- Re-evaluating Supply Chains
For businesses, the shift necessitates a reevaluation of supply chain strategies. Companies previously reliant on Chinese imports are now exploring the advantages of importing from Mexico to the US. This transition requires adjustments in logistics, supplier relationships, and compliance with trade regulations under the USMCA.
- Embracing Flexibility and Diversification
Embracing flexibility and diversification in sourcing and manufacturing becomes crucial. Companies find value in not putting "all their eggs in one basket," spreading risk across multiple countries to mitigate future disruptions.
Challenges and Opportunities
Both nations face unique challenges and opportunities as US and Mexico trade continues to flourish. The rapid growth in trade volume necessitates significant enhancements in cross-border infrastructure and customs processes to streamline the flow of import goods from Mexico to the US. Addressing these logistical challenges is crucial for maintaining the momentum of trade growth and ensuring that businesses can benefit from this partnership efficiently.
Moreover, the increased trade volume presents opportunities for technological advancement and logistics and supply chain management innovation. Investments in digital infrastructure, such as blockchain for secure and transparent transactions, can further enhance Mexico-US trade relations. These innovations not only support the current trade volume but also prepare both countries for future increases in trade activities. Embracing technology will be vital in overcoming logistical hurdles and setting a global standard for efficient and secure trade.
Strengthening Economic Resilience
The shift towards importing from Mexico to the US significantly contributes to the economic resilience of both nations. By diversifying supply chains and reducing reliance on distant suppliers, companies can mitigate risks associated with geopolitical tensions, natural disasters, and other disruptions. This strategic diversification strengthens the region's economic stability, making the North American economy more resilient to global shocks.
Additionally, the closer economic integration between the US and Mexico fosters an environment conducive to joint ventures and collaborations that can spur innovation and development across industries. This collaborative approach enhances both nations' competitive edge on the global stage and supports sustainable economic growth and job creation. As trade between the United States and Mexico deepens, leveraging this partnership for financial resilience and innovation becomes increasingly important.
Read more: China Import Export Data and Analysis
How Can Businesses Maximize Benefits from US-Mexico Trade Relations?
To fully leverage the advantages of importing from Mexico to the US, businesses should consider several strategic actions:
- Understand Regulatory Changes: Stay informed about the latest trade agreements and regulatory changes within the USMCA framework. This is crucial for understanding the complexities of US and Mexico trade efficiently and legally.
- Invest in Relationships: Building strong, long-term relationships with Mexican suppliers can lead to more favourable terms, better quality control, and more reliable supply chains. Trust and mutual understanding are vital to successful trade between the United States and Mexico.
- Leverage Proximity for Agile Supply Chains: Use Mexico's geographical proximity to your advantage by creating more agile and responsive supply chains. It can help businesses react quickly to market changes, reducing lead times and inventory costs.
- Focus on Sustainability: With increasing consumer and regulatory pressures, integrating sustainability into your supply chain is beneficial for the environment and your brand's reputation. Sustainable practices in Mexico-US trade relations can also lead to cost savings and innovation.
- Embrace Technological Innovation: Adopting new technologies can streamline operations, enhance transparency, and improve efficiency. Technology is a powerful tool in optimizing import goods from Mexico to the US, from blockchain for secure tracking to AI for demand forecasting.
Partnering with an expert like The Trade Vision, renowned for its mastery of EXIM data, can provide invaluable insights and strategies for overcoming the complexities of US and Mexican trade. Their expertise enables businesses to identify emerging trends, optimize trade processes, and unlock new import opportunities in US and Mexico trade.

Looking Ahead
Mexico-US trade relations appear poised for continued growth and collaboration. The Trade Vision suggests that businesses and policymakers recognize the importance of building resilient, efficient, and sustainable trade networks. Emphasizing the development of digital trade, improving border infrastructure, and fostering innovation, the path forward is marked by a commitment to leveraging trade for mutual benefit and environmental stewardship.
The ascendancy of Mexico as the primary source of import goods for the US marks a pivotal moment in global trade. This shift reflects the changing economic and geopolitical scene and offers a blueprint for future trade between the United States and Mexico. As businesses and governments navigate this new terrain, the focus will be on harnessing the full potential of this partnership to drive economic growth, innovation, and sustainability in the years to come.
FAQs
Q1. How will this affect consumer prices?
Ans: The impact on consumer prices is complex and varies by sector. While some products may see price reductions due to lower shipping costs, others might experience increases if manufacturing costs in Mexico are higher than in China.
Q2. What should companies consider when importing from Mexico to the US?
Ans: Companies should consider factors such as compliance with USMCA regulations, the potential for tariff changes, and the importance of developing solid relationships with Mexican suppliers. Understanding local laws and cultural nuances is also crucial.
Q3. Are there environmental benefits to this shift?
Ans: Yes, shorter shipping distances can reduce carbon emissions, making US and Mexico trade more environmentally sustainable than trans-Pacific shipments. Additionally, both countries could leverage this shift to invest in greener technologies and infrastructure.
Q4. What are the critical products imported from Mexico to the US?
Ans: The range of import goods from Mexico to the US is diverse, encompassing automotive parts, electronics, agricultural products, and more. Understanding the key products can help businesses identify potential opportunities for diversification and expansion within US-Mexico trade relations.
Q5. How do tariffs affect US-Mexico trade?
Ans: Tariffs play a significant role in trade between the United States and Mexico. Changes in tariff policies can directly impact the cost and flow of import goods from Mexico to the US. Businesses must stay informed about current tariff regulations to navigate importing from Mexico to the US effectively and maintain profitability.

India Is Considering Extending Parboiled Rice Tax at Risk to World Supply
20 Mar, 2024
0
In a significant development that could ripple through global food markets, India, a dominant player in the international rice trade, is contemplating extending an export tax on parboiled rice. This move has sparked concerns over its potential impact on world supply, especially considering the vital role of rice export from India in meeting global demand. As nations worldwide grapple with food security and price stability challenges, India's decision carries weight far beyond its borders. This article looks into the complexities of this situation, offering insights into the current state of parboiled rice exports from India, the implications of the proposed export tax, and the broader context of rice export latest news.
India's Role in Global Rice Markets
India is the world's largest rice exporter, contributing significantly to the global supply of this staple grain. The country's fertile lands and favourable climate conditions have historically positioned it as a key supplier of various rice varieties, including nutrient-rich parboiled rice. However, the government's consideration of extending the export tax on rice in India has raised alarms about potential disruptions in the international food supply chain.
The Significance of Parboiled Rice Exports from India
Parboiled rice, known for its enhanced nutritional profile and cooking qualities, represents a substantial portion of India's rice exports. It serves as a crucial food source for millions worldwide and a vital component of food security in several developing nations. The prospect of an extended export tax on this commodity threatens not just the livelihoods of Indian farmers and exporters but also the stability of global rice prices and supplies.

How Will an Export Tax Affect Farmers and Exporters in India?
- Impact on Farmers: Farmers specializing in parboiled rice could face reduced income due to lower demand from international markets. With rice export from India constituting a significant part of their livelihood, the extended tax could lead to economic uncertainties for these agricultural producers.
- Effect on Exporters: Exporters dealing in parboiled rice exports from India may encounter challenges in maintaining their market share on the global stage. The tax could necessitate a shift in business strategies, focusing more on domestic markets or exploring alternative crops not subject to export restrictions.
Read more: The white staple is high in demand
What Are the Global Alternatives if Indian Rice Exports Decline?
- Seeking Other Suppliers: Countries dependent on rice export from India might turn to other major rice-producing nations like Thailand, Vietnam, and Pakistan. These countries could increase their exports to fill the gap left by India. Still, it remains to be seen if they can match the price and quality that buyers have come to expect from Indian rice.
- Diversifying Food Sources: A decline in parboiled rice exports from India may also prompt importing countries to diversify their food sources. It could involve investing in local agricultural development or seeking alternative grains like wheat, maize, or quinoa, which could help reduce dependence on rice imports and enhance food security.
How Does the Export Tax Reflect on India's Trade Policy and Global Standing?
The contemplation of extending the export tax on rice in India marks a significant moment in the country's approach to trade policy and its role in the global agricultural market. This move reflects a broader strategy to balance domestic food security with international trade obligations, a dilemma faced by many countries that are key food producers. As a leading supplier in the rice export latest news, any significant shift in its export policies can alter global rice availability and prices, impacting countries dependent on these imports for their food needs.

Looking Ahead
The discourse around extending the export tax on rice in India reflects broader themes of sustainability, equity, and resilience in global trade practices. The importance of a cohesive trade vision becomes apparent as nations navigate the complexities of ensuring food security while promoting sustainable agricultural practices. As advocated by The Trade Vision, the expert in EXIM data, such a vision emphasizes the need for policies that support both local and global needs, supporting activities that are favorable to the earth, ethical for everyone, and beneficial for business.
India's contemplation of extending the export tax on parboiled rice presents a critical moment for global food security and trade dynamics. As the world watches closely, India's decisions will affect its domestic market and have far-reaching implications for global rice supply and prices. Global stakeholders must engage in dialogue, fostering a trade environment that balances the needs of all parties while ensuring the long-term sustainability of our planet's food systems.
FAQs
Q1. What is parboiled rice?
Ans: Parboiled rice is partially precooked rice, making it more nutritious and easier to store than white rice.
Q2.Why is India considering an export tax on rice?
Ans: The primary reasons include ensuring domestic food security, managing water resources, and stabilizing local market prices amid fluctuating global demand.
Q3. How could the export tax affect global rice prices?
Ans: By reducing the quantity of rice available for export from India, the tax could lead to higher global rice prices due to supply constraints.
Q4. Can other countries compensate for the shortfall in rice exports from India?
Ans: While other rice-exporting countries might increase their exports, it's still being determined whether they can fully offset the reduction from India, especially in the short term.
Enquiry
0